What Is Technical Analysis?
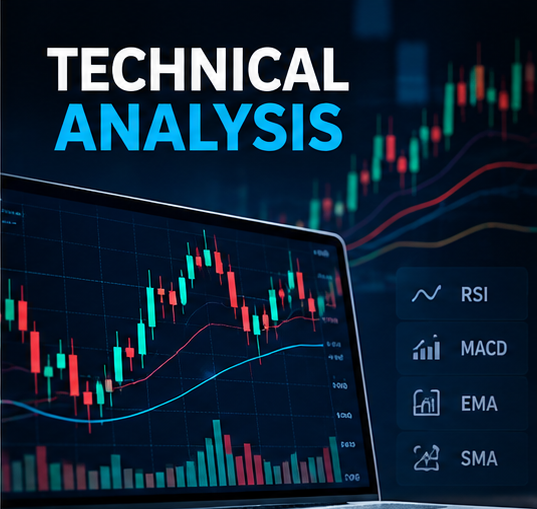
Technical analysis studies historical price action and market data to identify trends, patterns and potential trading opportunities. It does not guarantee what price will do next; instead, it helps traders create structured scenarios.
Trends and Market Structure
An uptrend generally forms higher highs and higher lows, while a downtrend forms lower highs and lower lows. A sideways market often moves within a range. Identifying the broader structure can help traders avoid low-quality setups.
Support and Resistance
Support is an area where buying interest has previously helped limit declines. Resistance is an area where selling pressure has previously limited advances. Traders often watch for breakouts, rejections and retests around these zones.
Candlestick Charts
Candlesticks show the open, high, low and close for a chosen period. Patterns such as engulfing candles, pin bars and doji formations can provide clues about momentum when interpreted in context.
Popular Indicators
Moving averages can help identify trend direction, RSI can provide momentum information, and MACD can help traders study momentum and trend changes. Indicators are tools, not guarantees.
Building a Setup
A disciplined technical setup should define the market context, entry condition, invalidation level, position size and exit plan before the trade is opened.
Final Thoughts
The goal of technical analysis is not to predict every move. It is to identify situations that fit a tested process and a clearly defined risk plan.